EA-1 Veronica
The Resistivity Temperature \(\rho-T\) Measurement Automation
To increase the experiment processes, I designed and assembled the resistivity-temperature 𝝆-T measurement automation. "EA-1" stands for "Experimental Apparatus No.1", and the nickname of the project "Veronica" means "she who brings victory".
Specifications:
∙Measures 15 oxide or alloy pallets simultaneously
∙Range of Temperature: 70K to 400K
∙Range of Resistivity: \(1\mu\Omega cm\) to \(1G\Omega cm\)
Original CAD Design
▲Colored 3D view. Three images show the evolution of the design.(Click to enlarge)
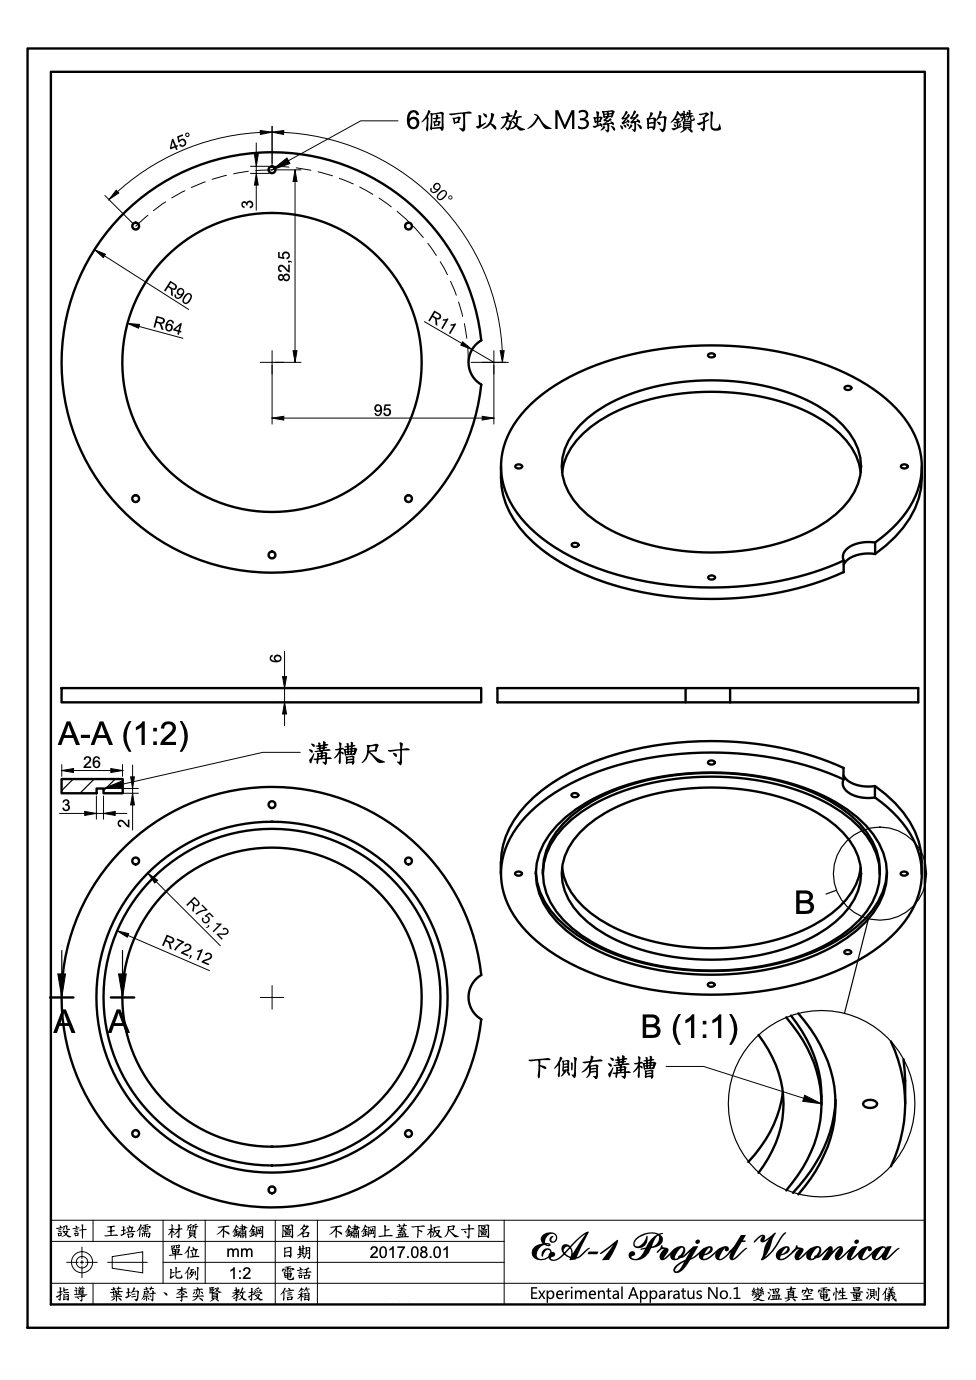
▲The exploded view and the example of a dimensional drawing.(Click to enlarge)
Exterior
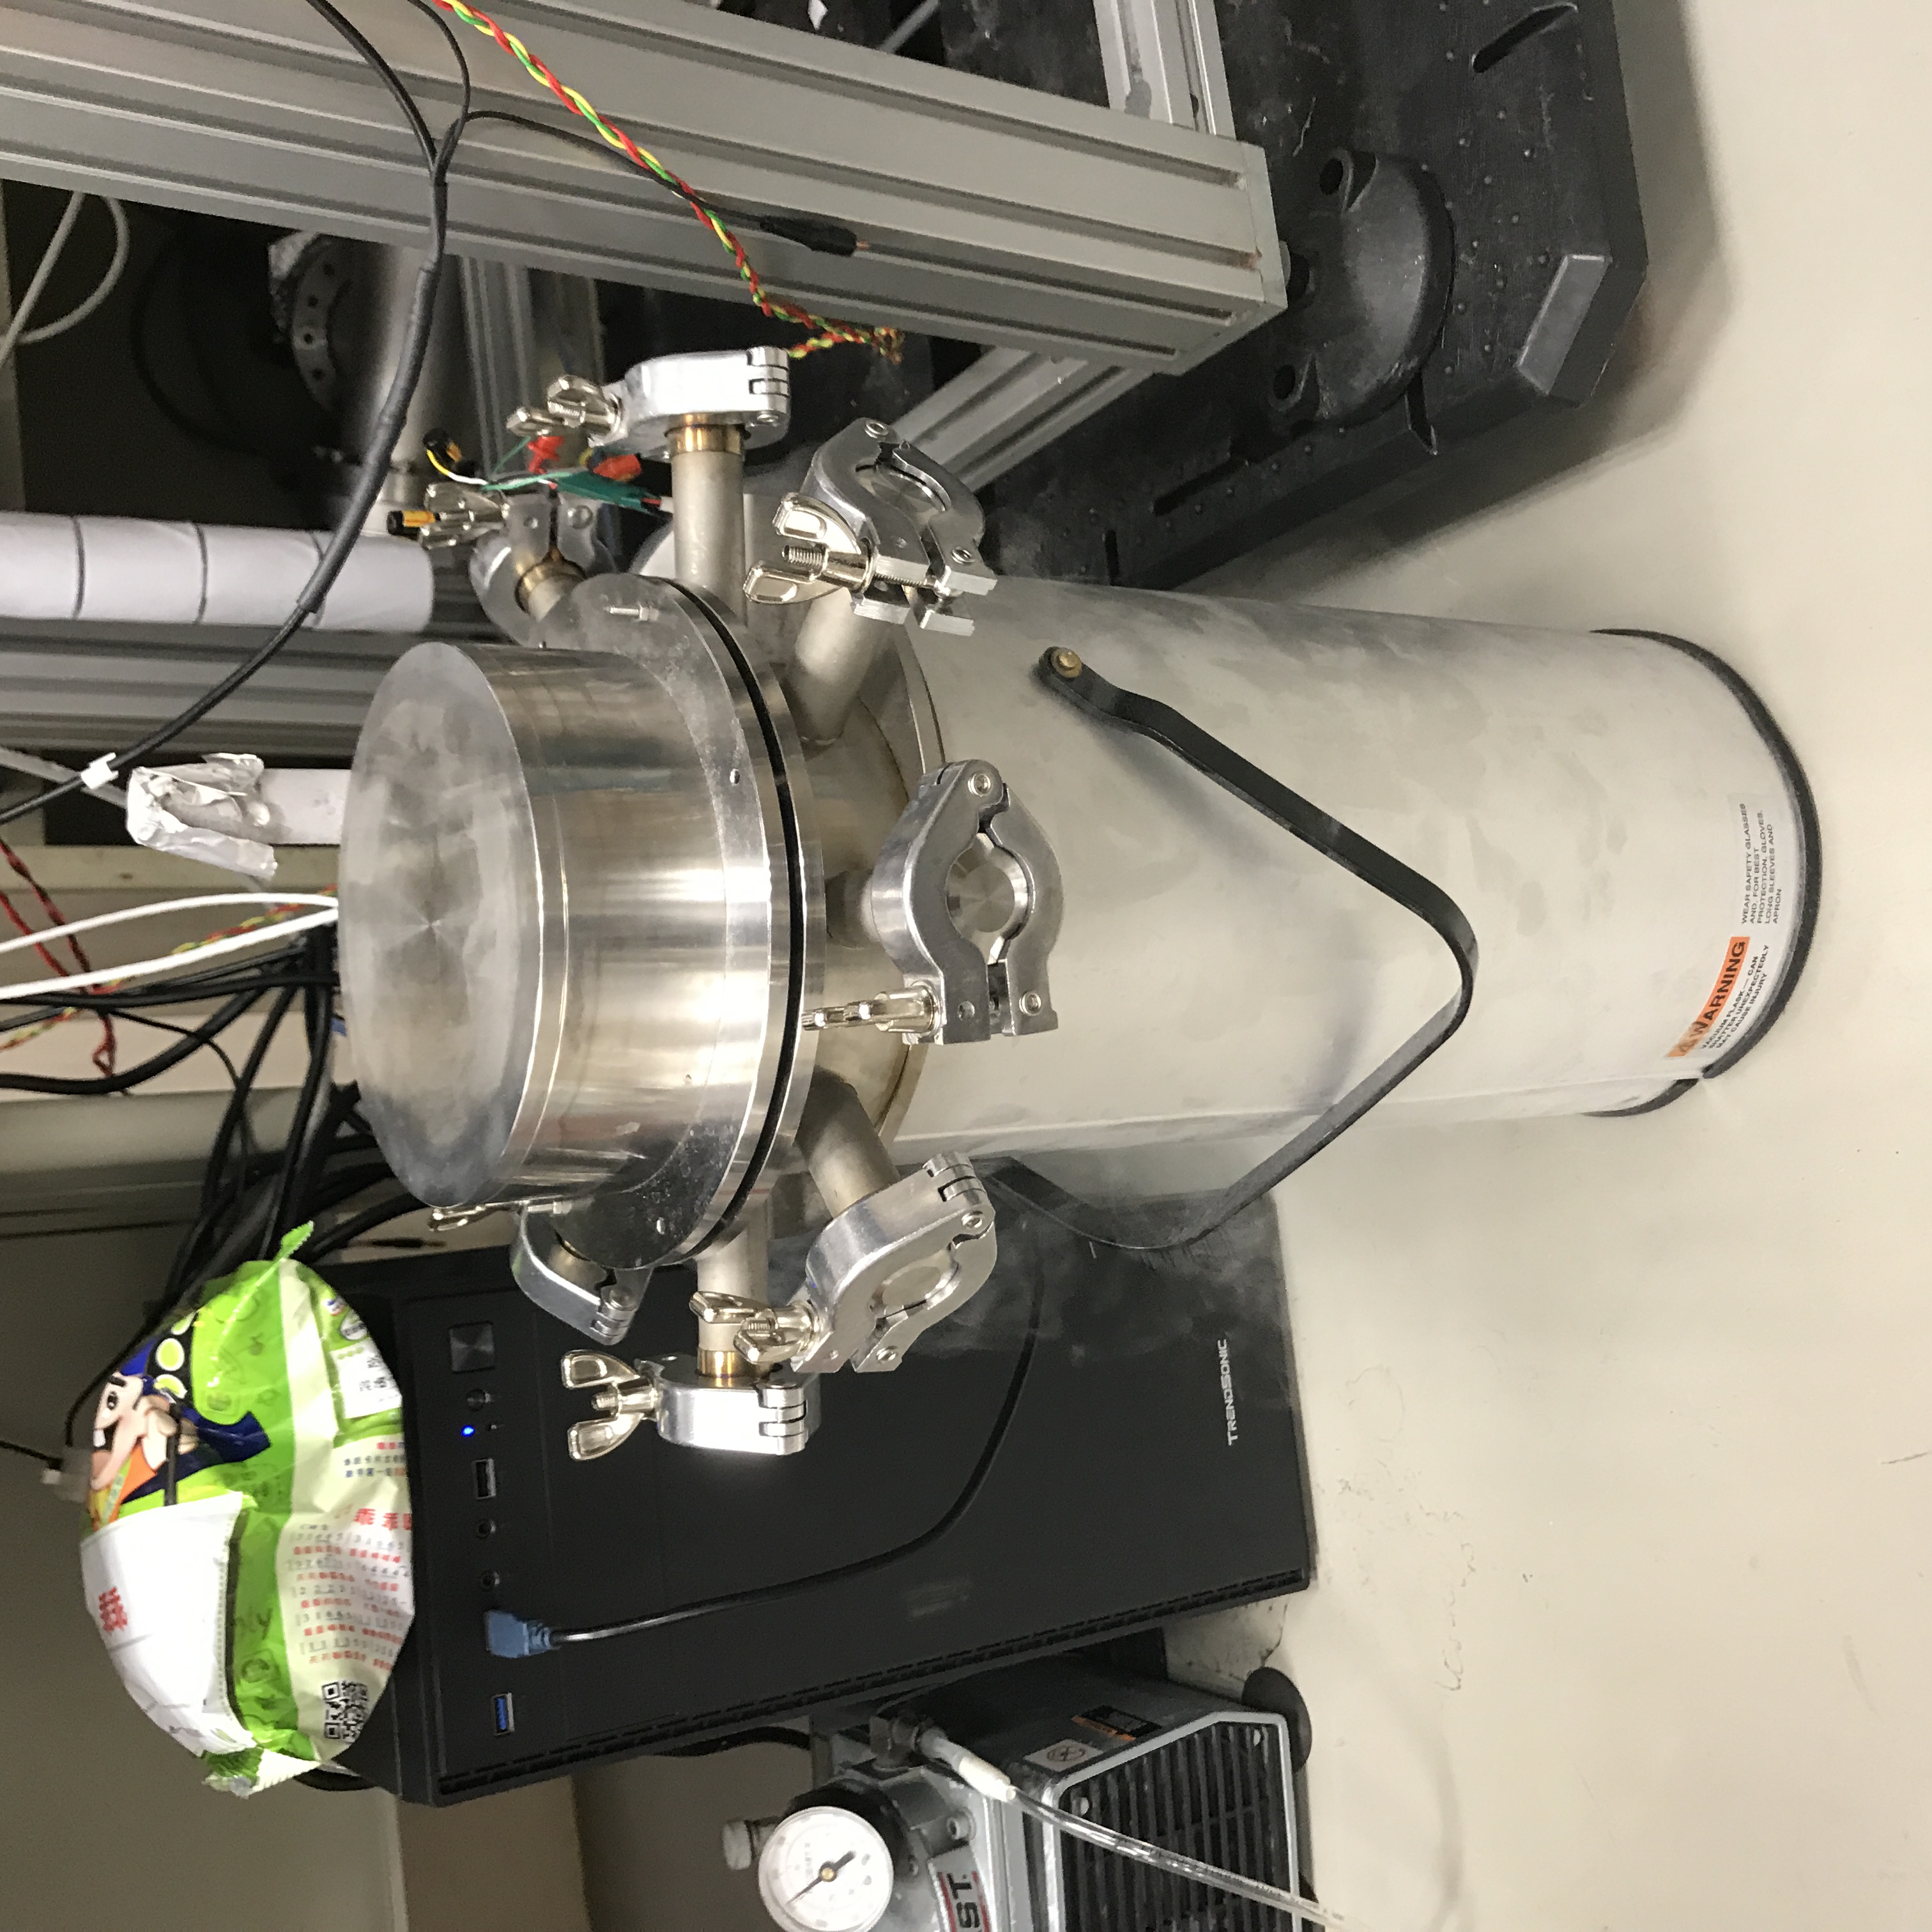
▲EA-1
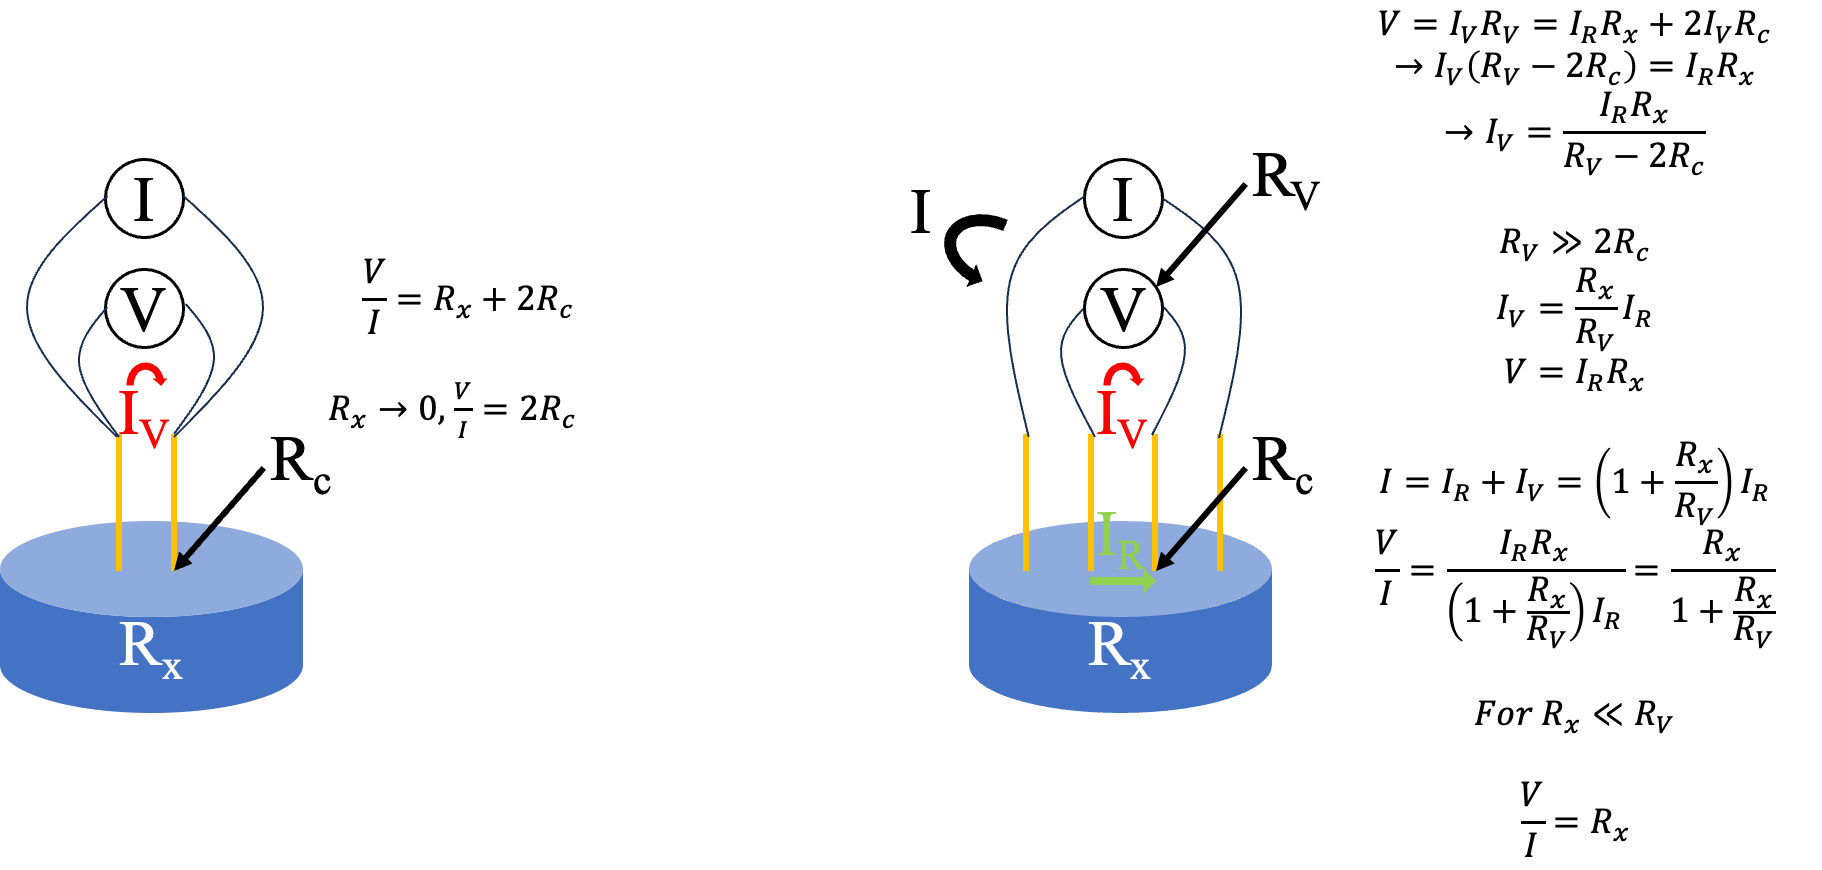
▲The Derivation of the 4-Point Probe Method. \(R_c\) represents the contact resistance (\( \sim 10\Omega \)), and \(R_V\) is the internal resistance of the voltmeter (\( > 10M\Omega \)), such that \(R_V >> R_c\). For small resistance and superconductivity measurements, the contact resistance \(R_c\) becomes significant, making the traditional 2-point probe method inaccurate. The 4-point probe method eliminates the contribution of the contact resistance \(R_c\). (Click to enlarge)
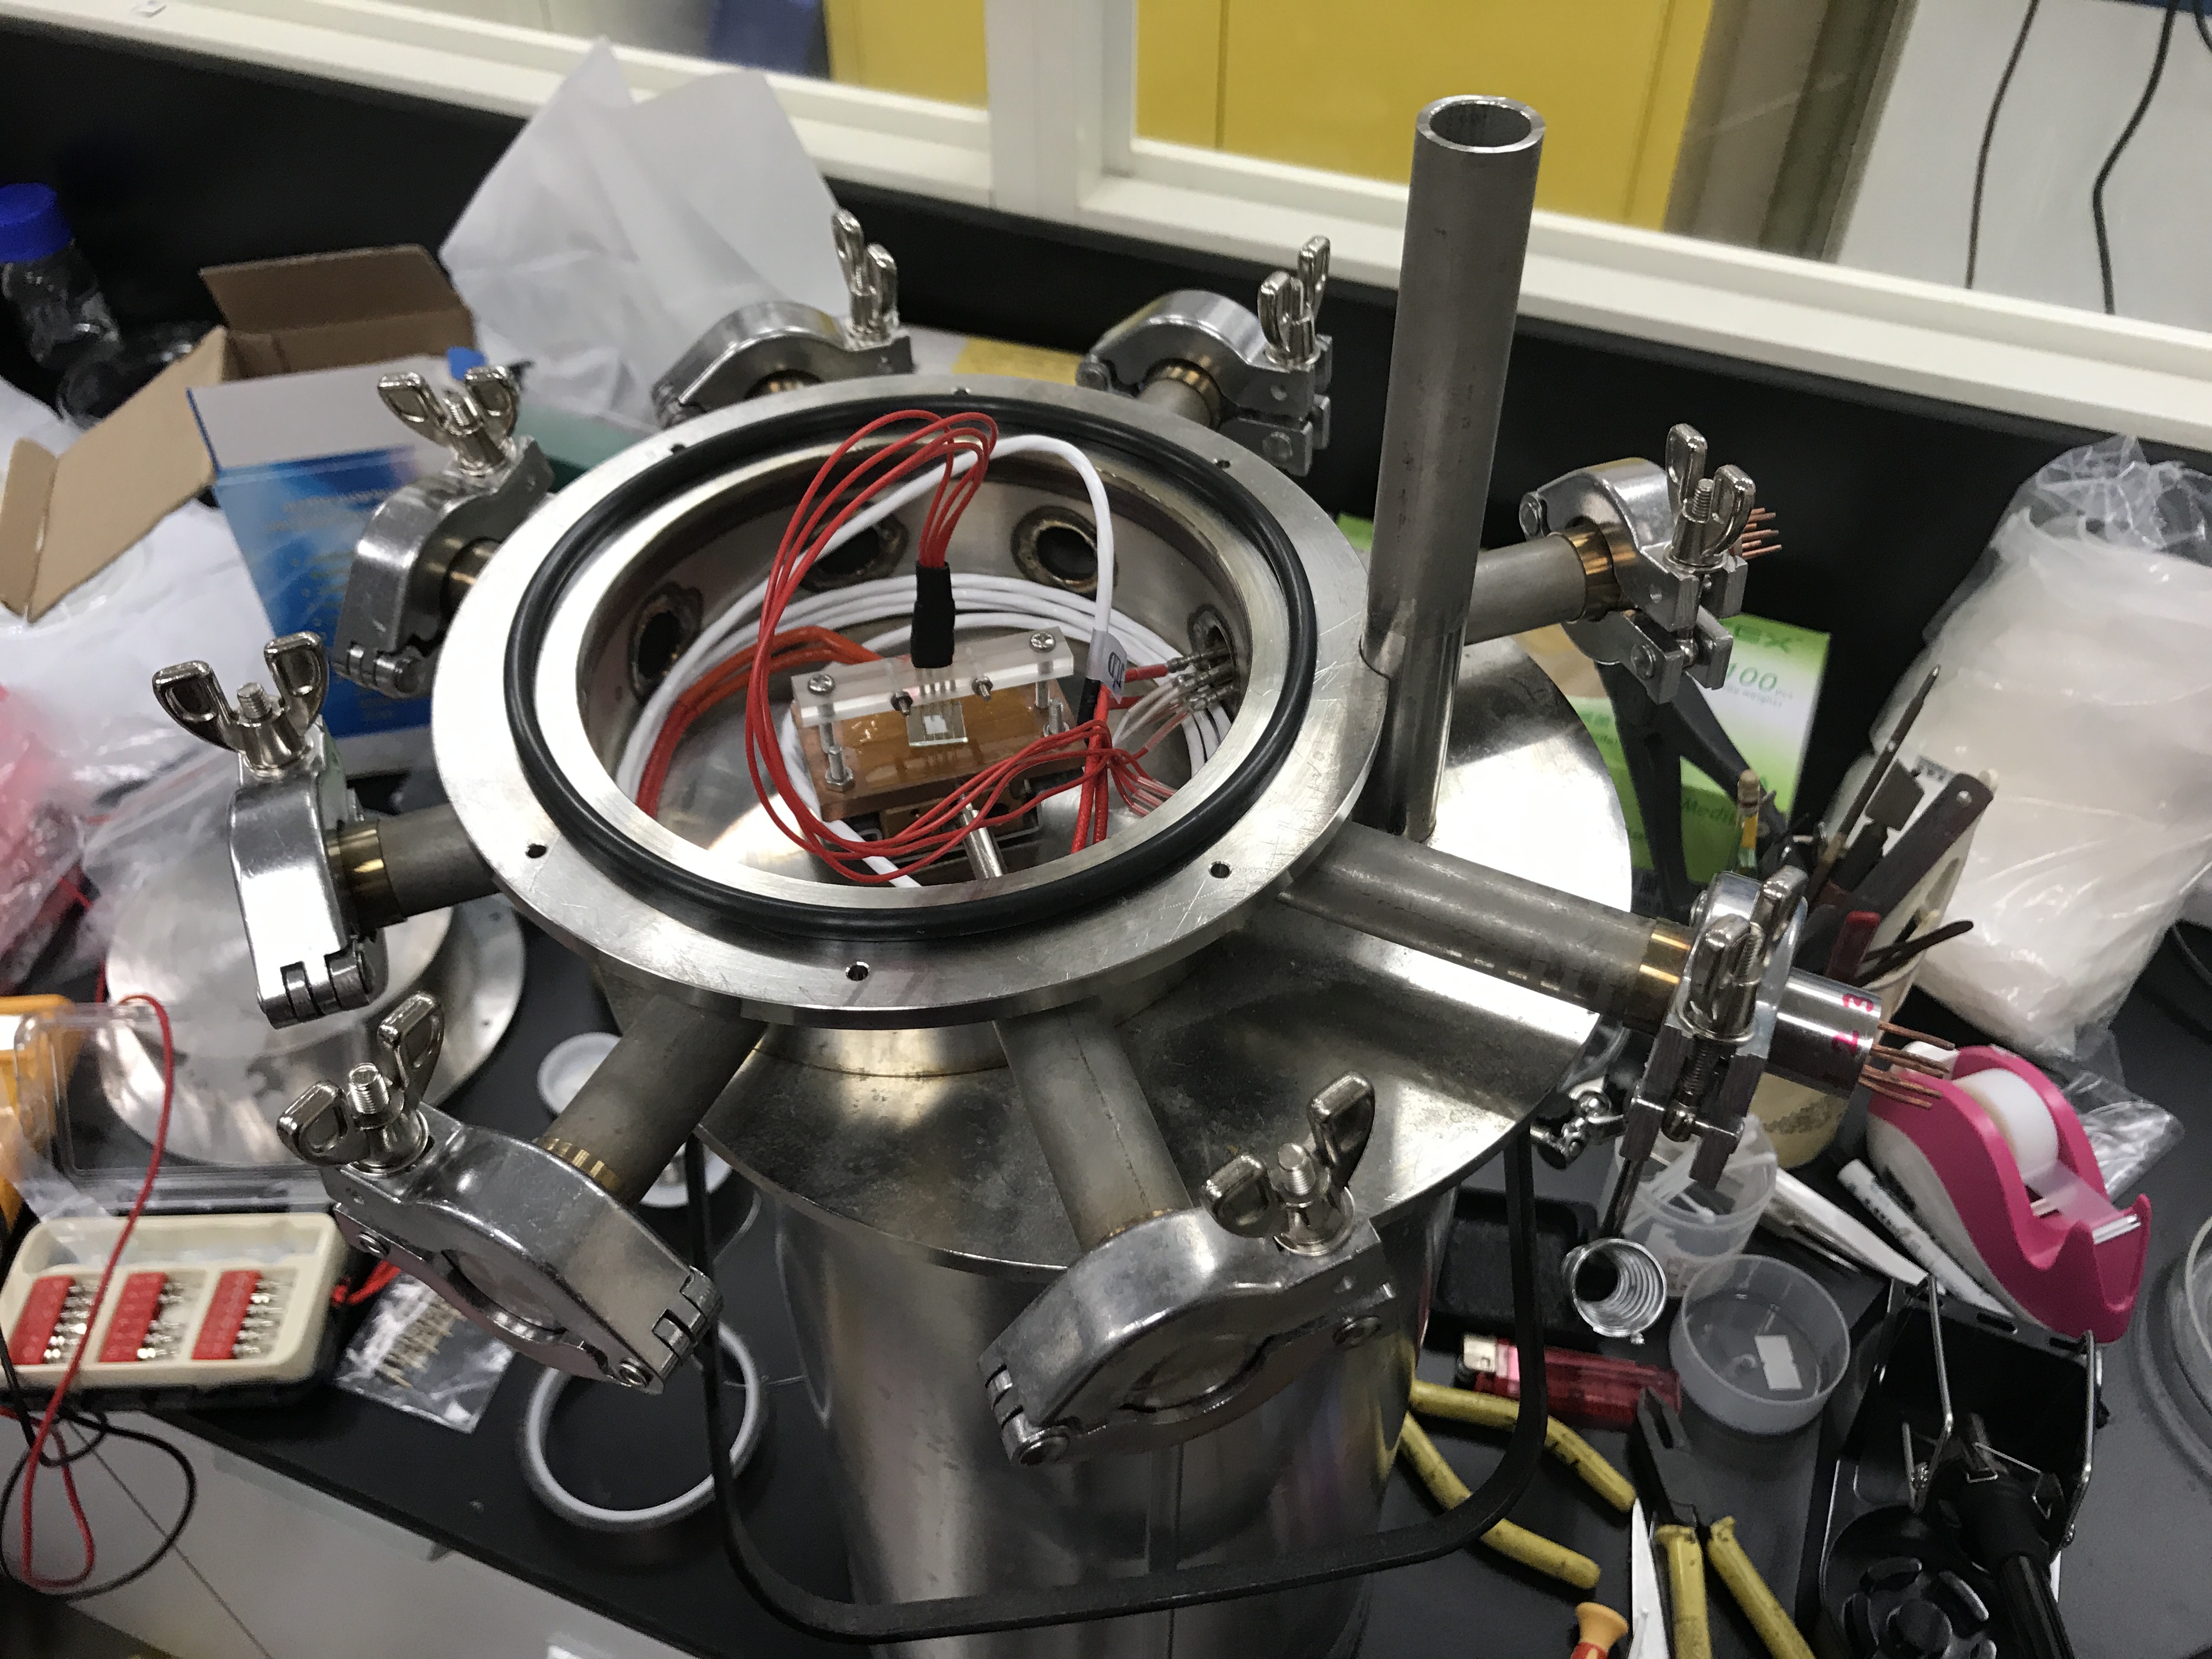
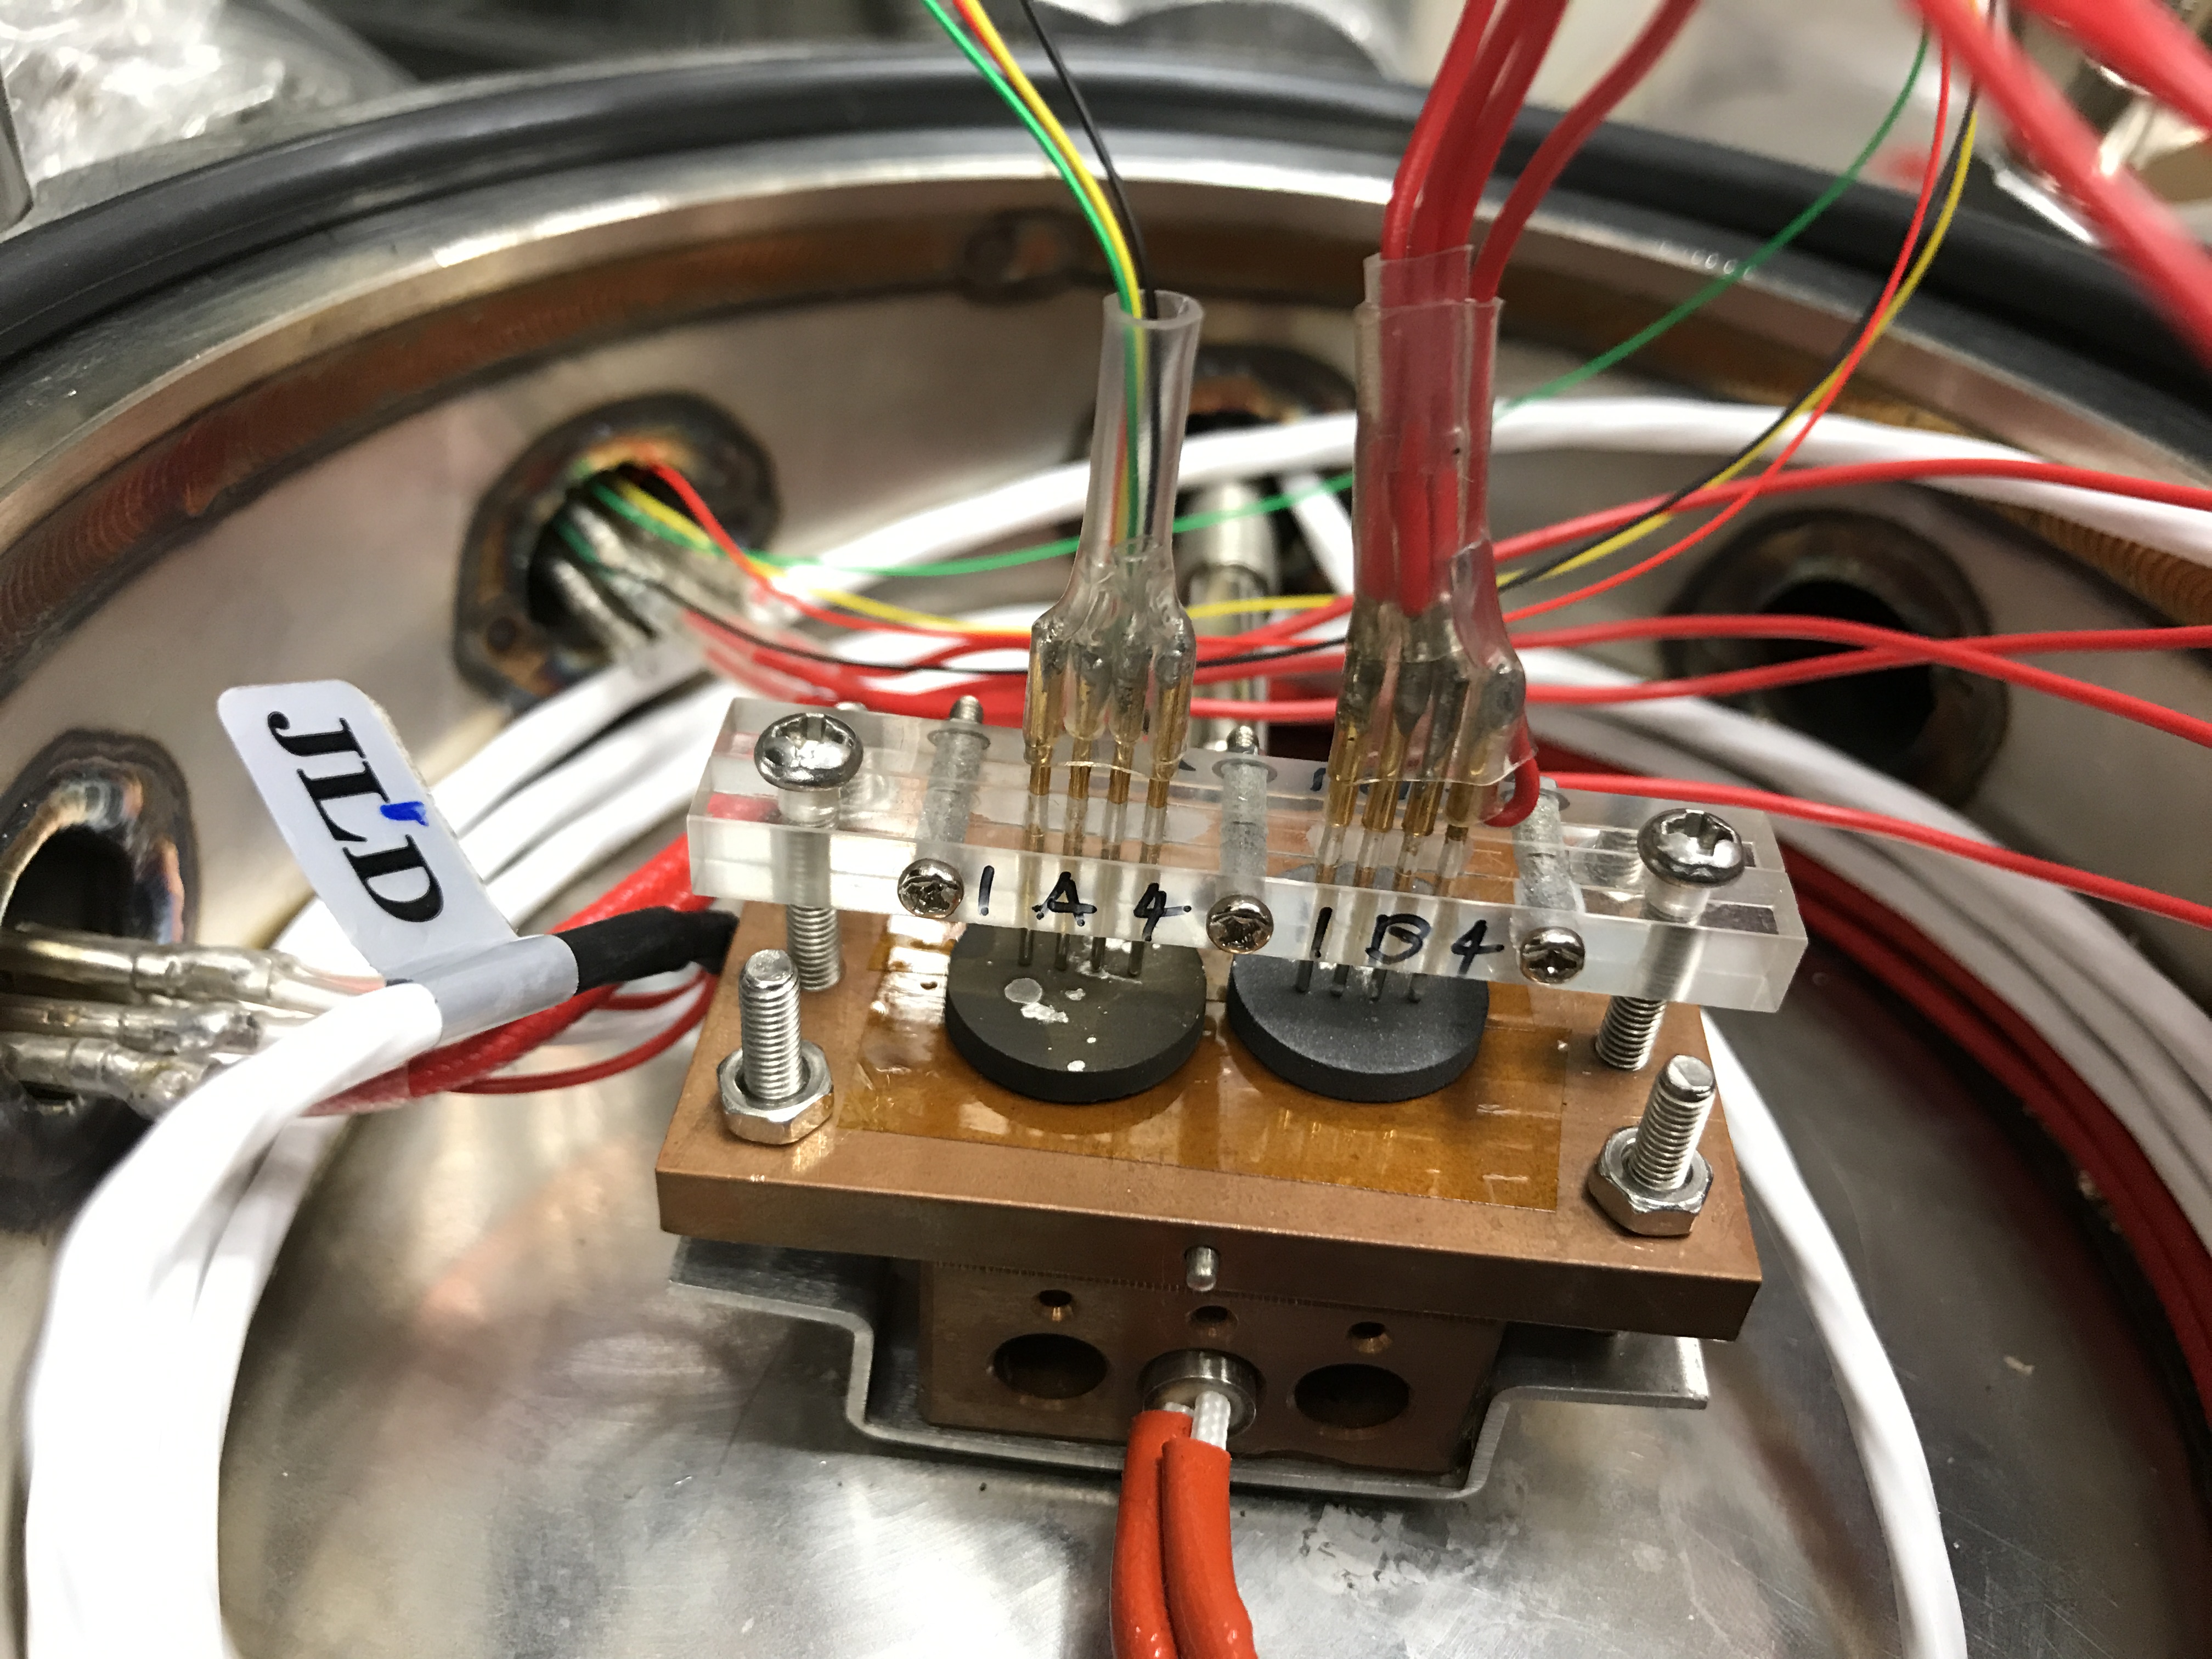
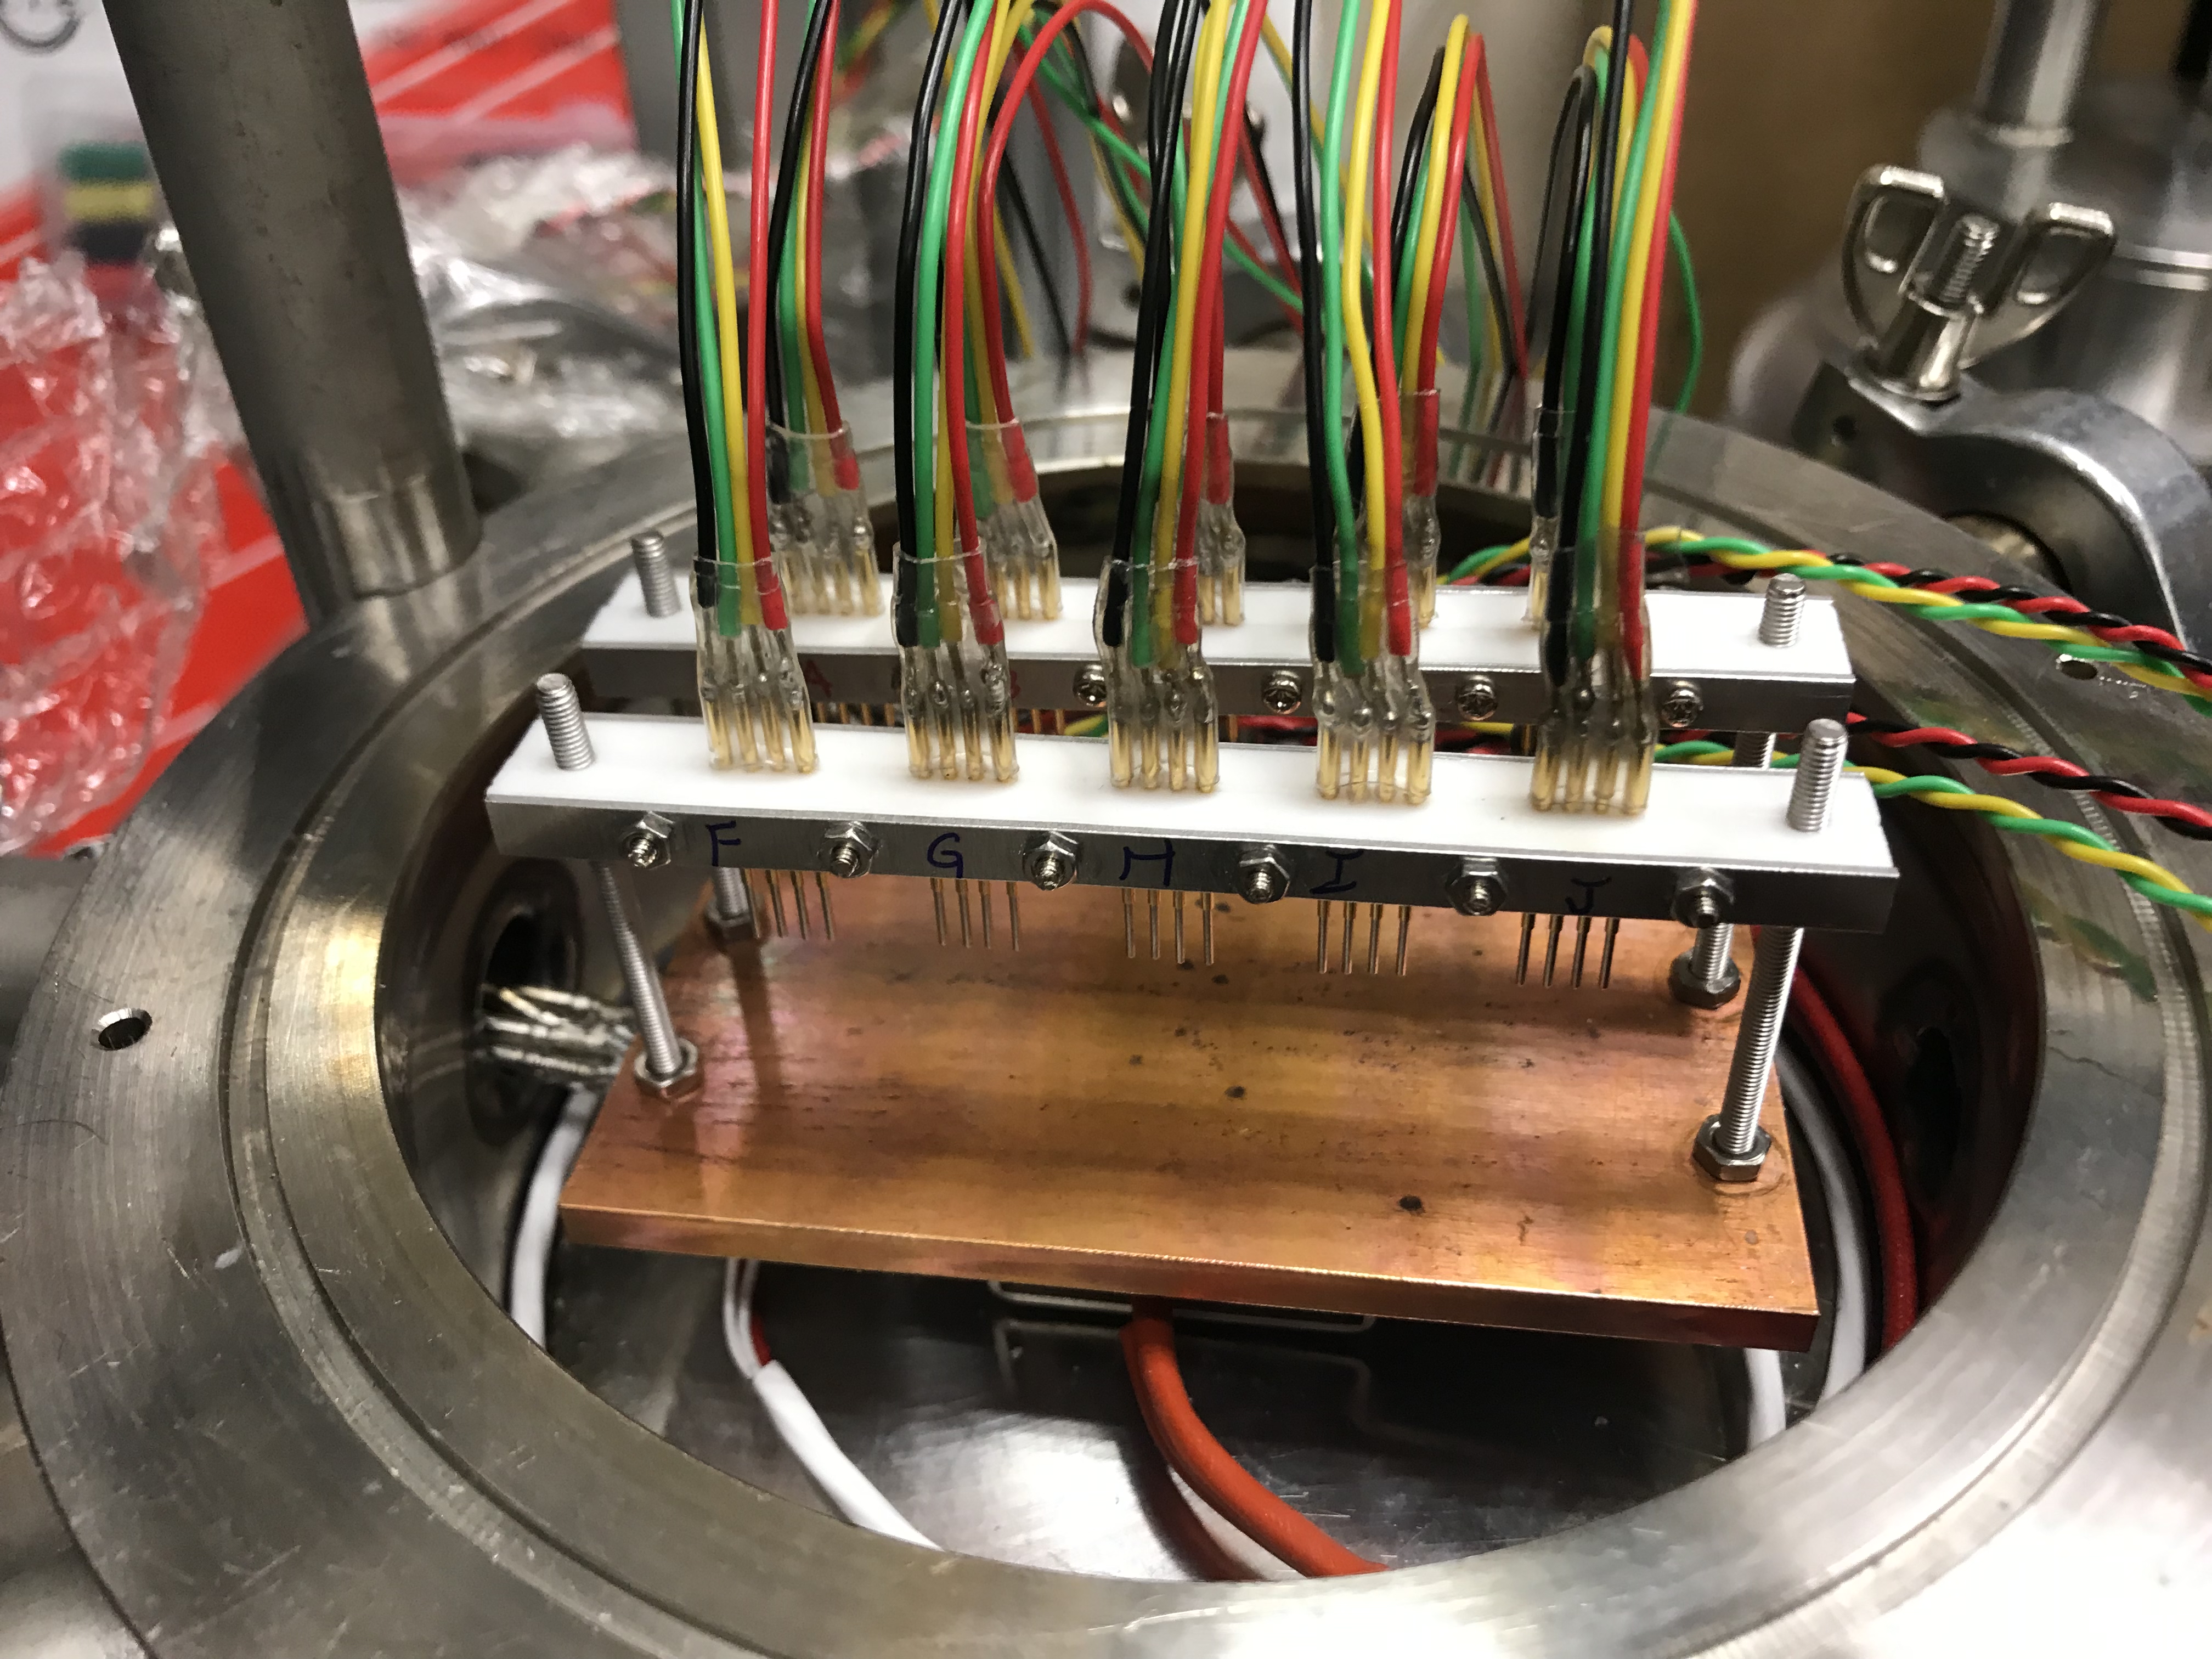
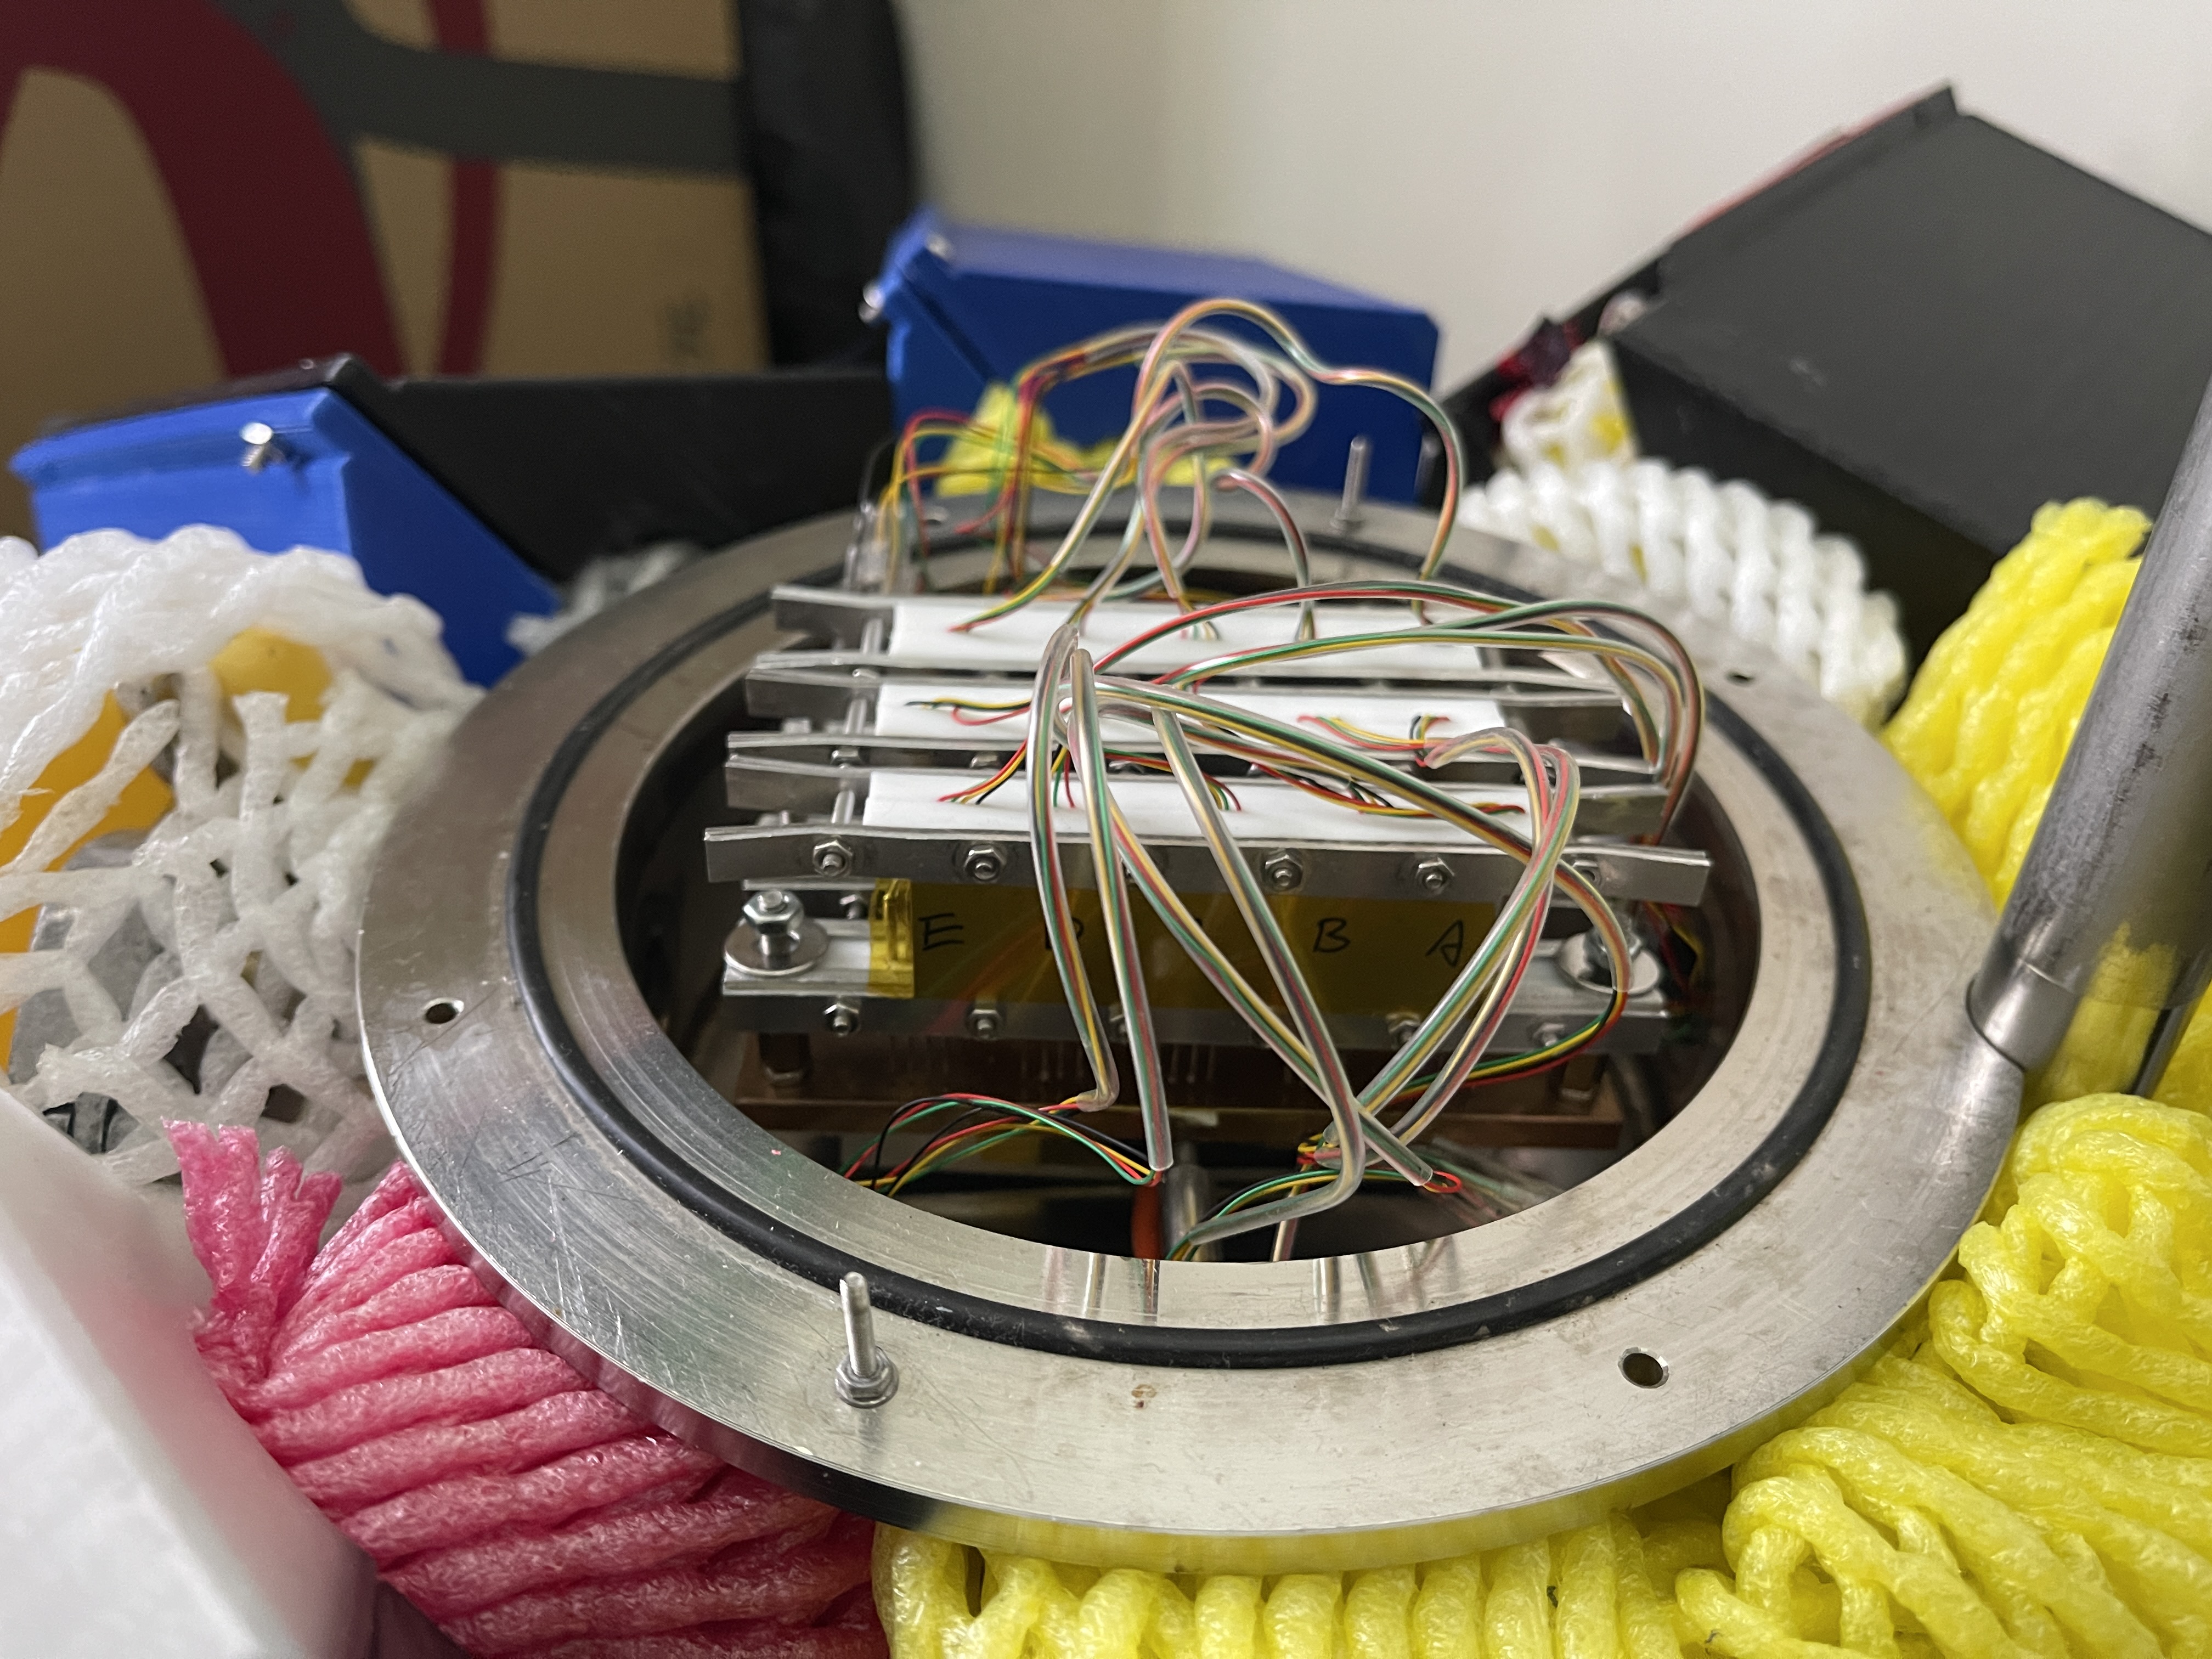
Improvement of the platform
The following images show the modification process, from a single sample, double samples, to 10 samples, and 15 samples.(Click to enlarge)
Instruments I have integrated:
| Temperature Controller | |
|---|---|
| Cryo-Con 32B × 2 | |
| Meters | |
| HP 34420A | Keithley 237 & 617 |
| Lock-In | |
| SR830 × 4 | |
LabVIEW Design
LabVIEW codes control and collect information from the instruments through GPIB. Instruments include Keithley 237 and 617 meters, HP34420A meter, Stanford Research Systems SR830 Lock-in, and Cryo-Con 32B temperature controller.The original LabVIEW code was not modularized, making it difficult to expand. After modularization, the program became scalable to multiple measurement loops.
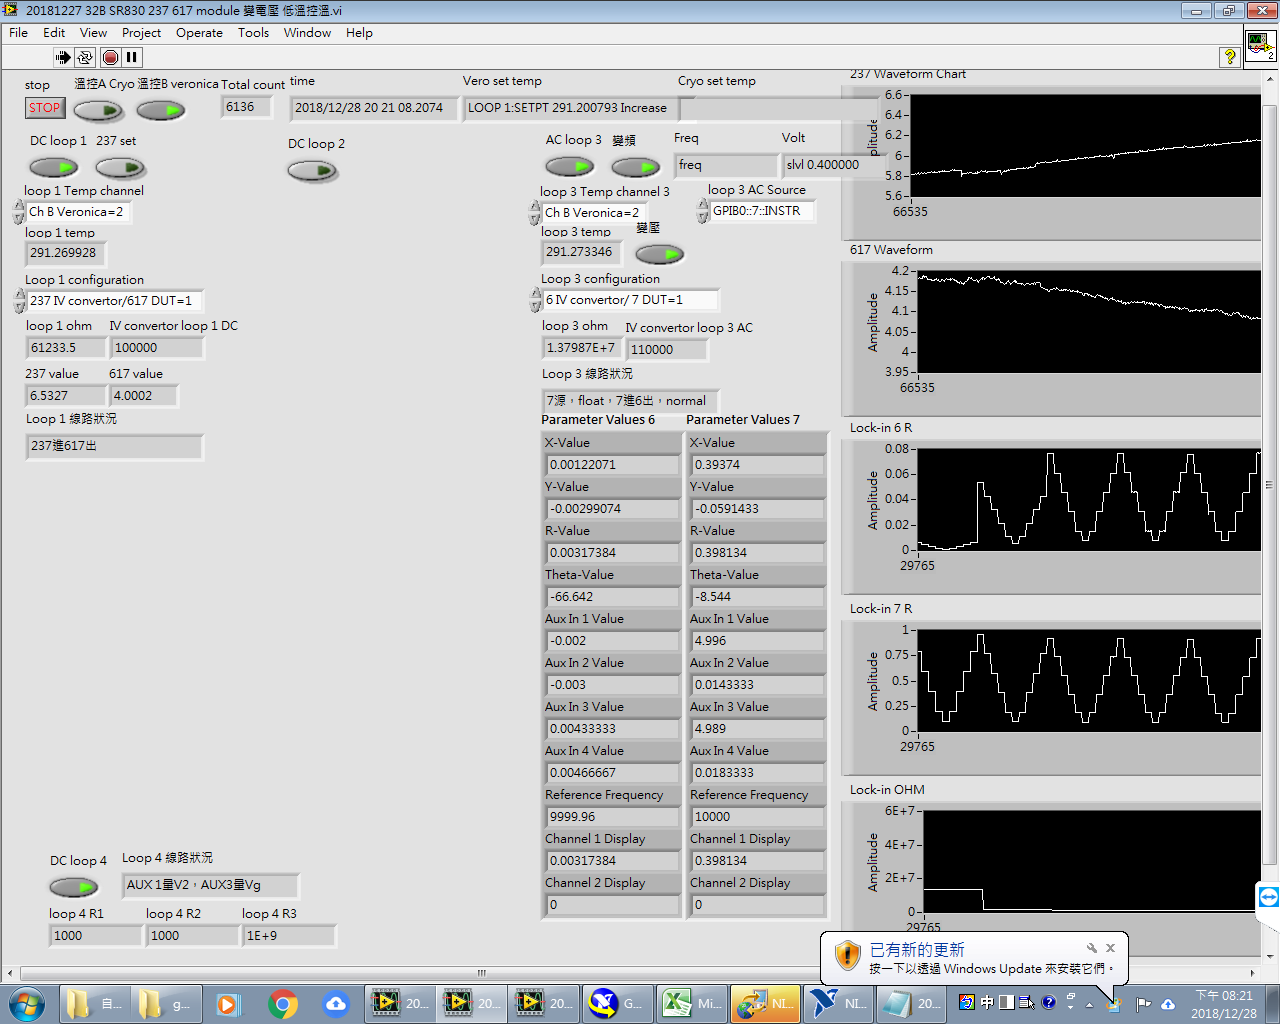
▲Front panel view.(Click to enlarge)
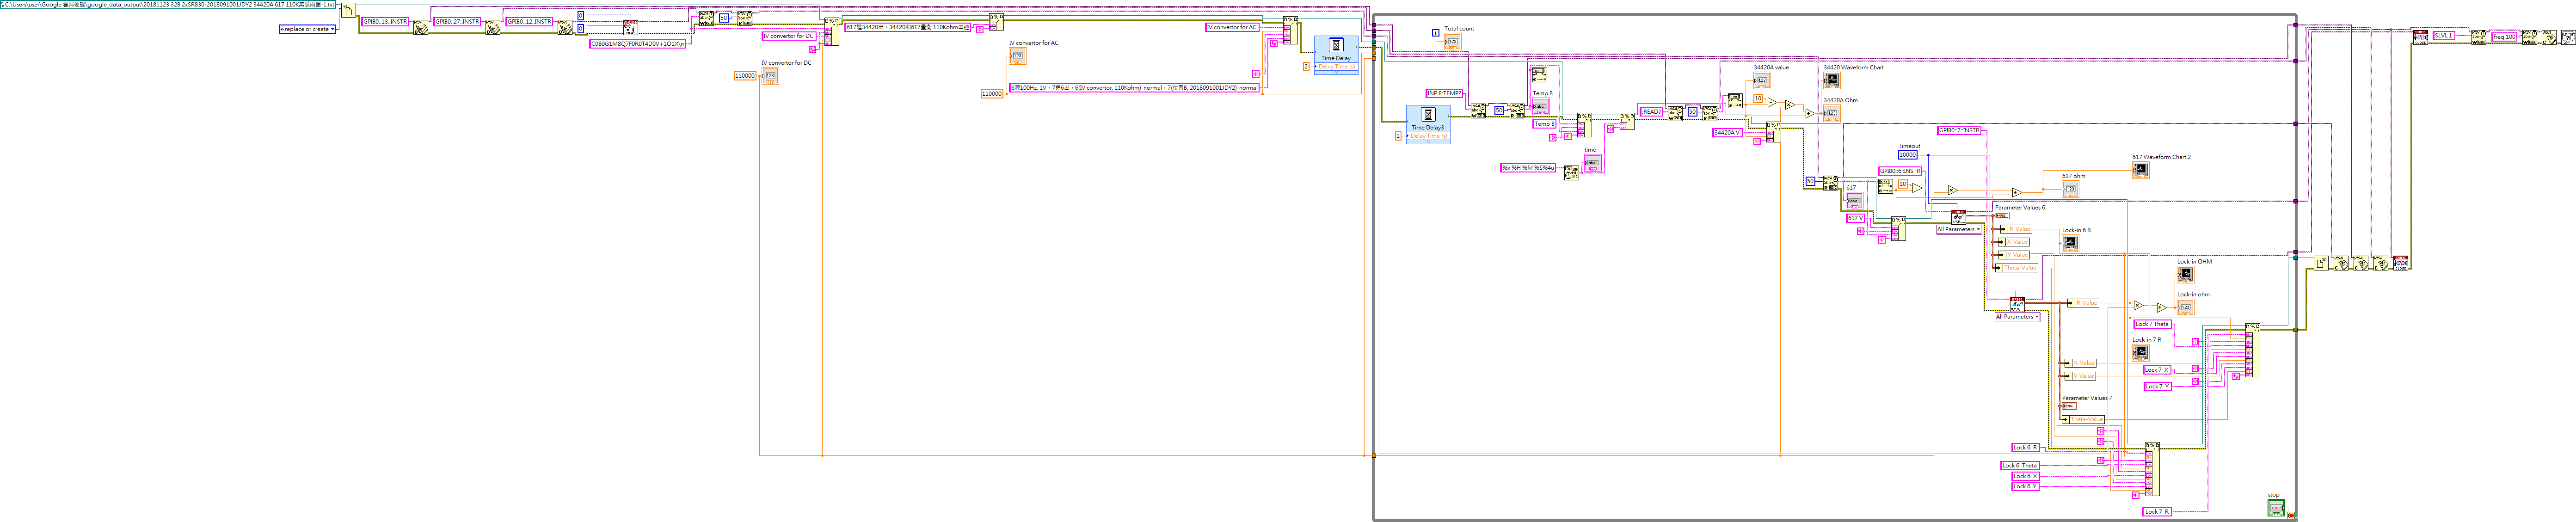
▲Block diagram view of early design.(Click to enlarge)

▲Block diagram view of modular design.(Click to enlarge)
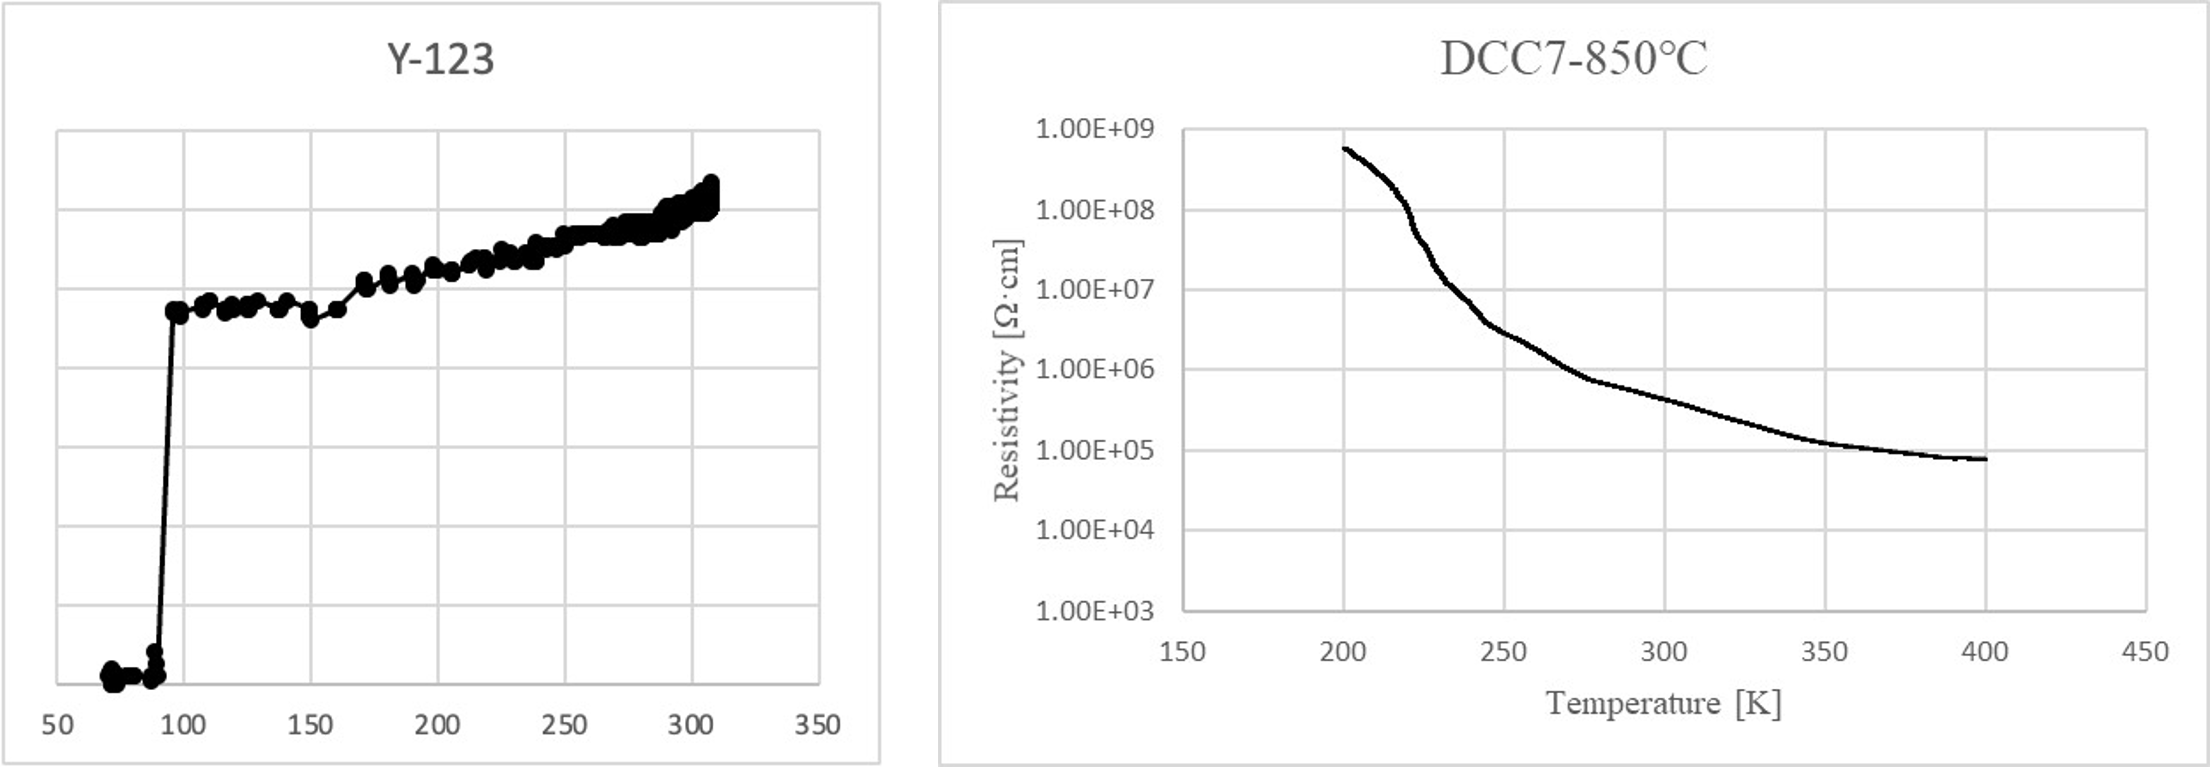
Material Properties Measurement and Improvement in Precision
The following examples illustrate the modification process. Initially, the measurement accuracy was lower, but it improved later on with smoothed data.
▼The left image shows the Y123 (\(YBa_2Cu_3O_x\)) superconductor exhibiting superconductivity below 93K. The right image displays the high-entropy oxide labeled DCC7. (Click to enlarge)
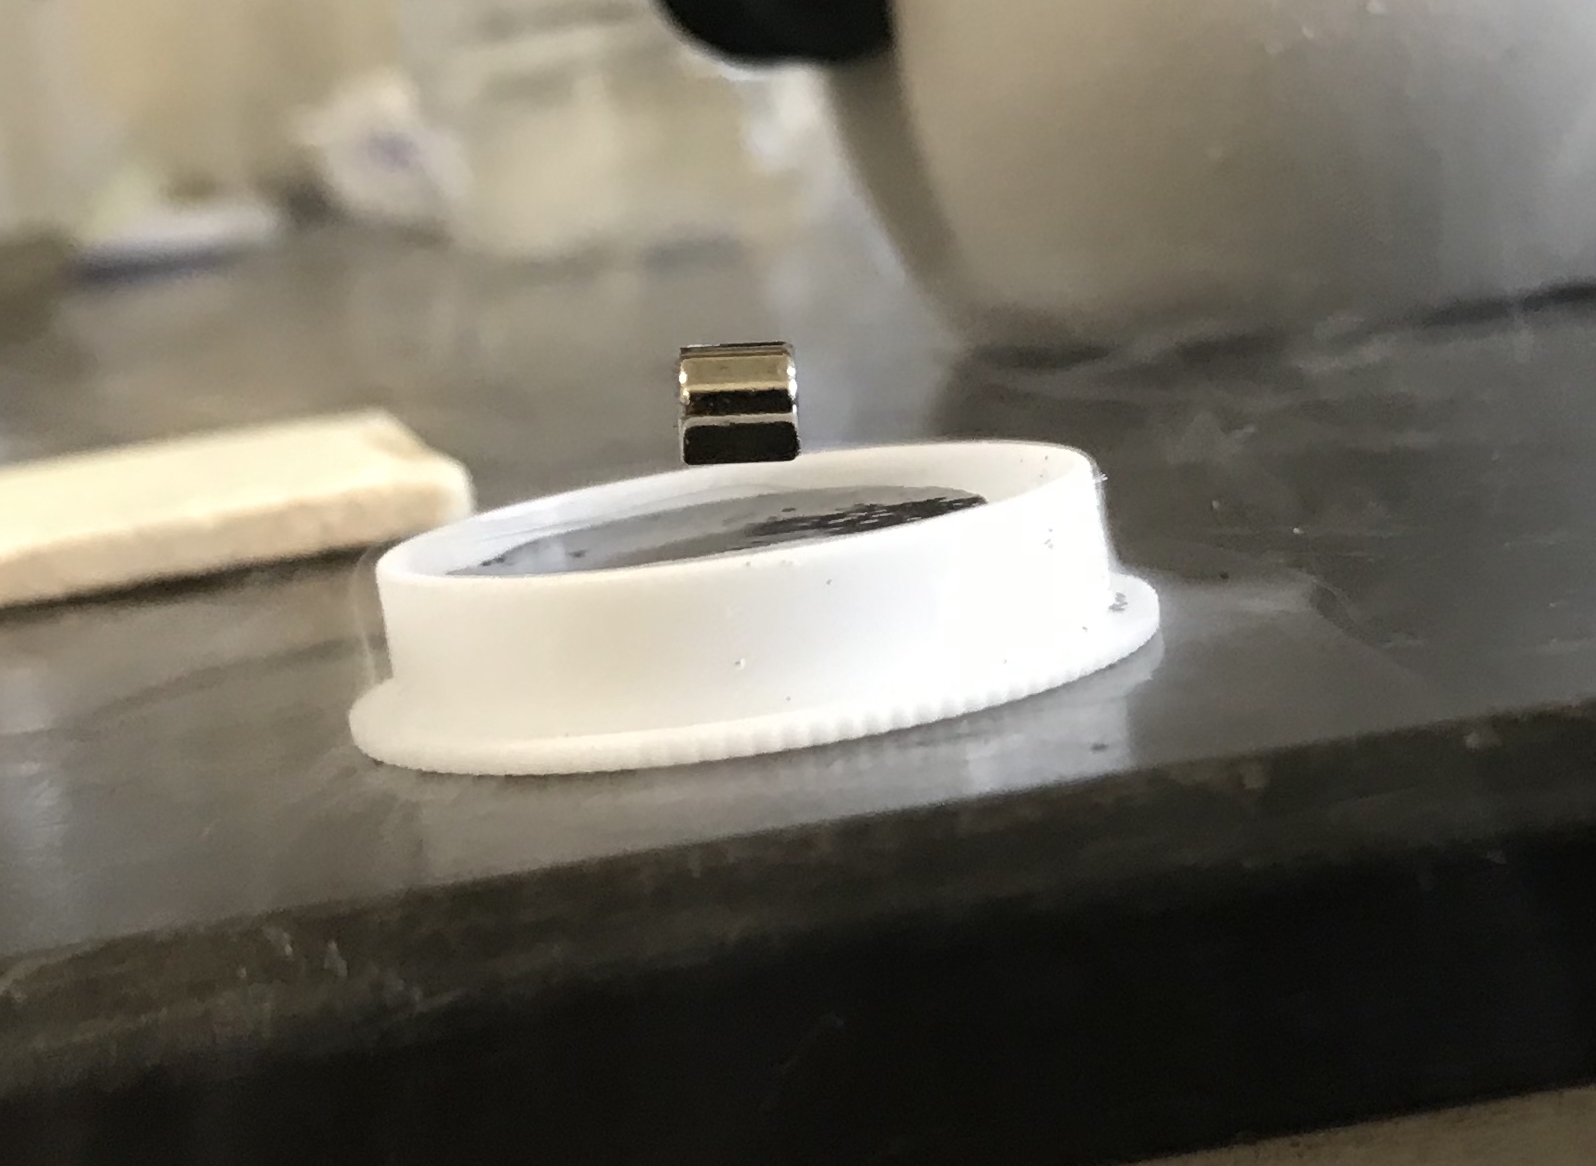
▲I synthesized Y123 superconductor, which exhibited the superconducting Meissner effect below 93K. (Click to enlarge)
Originally written in Chinese by the author, these articles are translated into English to invite cross-language resonance.
 Peir-Ru Wang